Once I started getting a handle on deploying updates with Configuration Manager my mind quickly moved to proving that it actually worked. How could I prove to myself and management that the solution I was putting together actually improved our patch compliance. I had started similar work in our previous management tool and had gotten far enough to know that we weren’t in great shape.
Configuration Manager has a bunch of built-in reporting so I started sifting through it trying to understand what was there. I was left … disappointed. The built-in compliance reports are all at the individual Software Update Group level. While useful that’s not what I was looking for. So my first inclination was to look to see what custom reports or dashboards existed in the Configuration Manager community. There’s quite a few of them and range from those that are freely available:
- Garry Simmons: Software Update Compliance Dashboard
- Simon Broullard: Software Update Groups Compliance Dashboard Revisited
- SCConfigMgr: Patch Compliance Reporting in Configuration Manager with PowerBI
to those that are not free but are from from ‘names you can trust’:
- System Center Dudes: Software Update Reports
- CT Global: Insight Analytics
- Enhansoft: Enhansoft Reporting
Despite all of that being available I still wanted to build my own. In part because I suffer from the ‘Not Built Here’ syndrome as much as the next person but because I always … always … want to know how things work. While it’s hard to justify the labor cost it takes to build a custom dashboard there’s no other way to truly understand how reporting works. There will be a follow-up post to this one talking about the lessons I learned along the way but this post is intended to share the fruits of that labor.
What Does This Dashboard Do?
The focus of this dashboard is to report compliance across all devices in the organization. For my purposes I’m defining compliance as having all deployed and applicable updates installed within 14 days of their deadline. In order to make that feasible these reports work on the update deployment (or assignment) level. A device is considered unknown if any deployment status is unknown. If there are no unknown but one or more of the assignments is not compliant then the device is not compliant. If and only if all deployments are compliant is the device considered compliant.
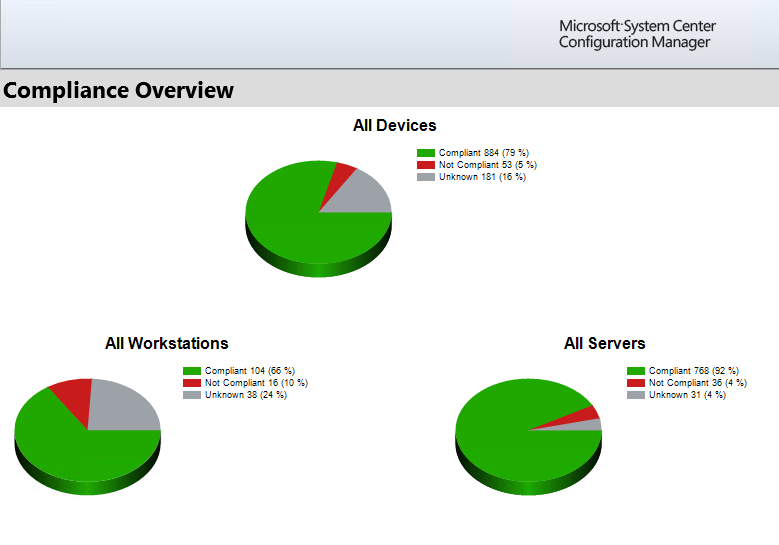
Overall Compliance
This is intended to be the top-level report that acts as the dashboard. This is the report that tells you and your management how good or bad things are. There’s multiple datasets and charts that allow you to breakdown the top level Workstation vs Server split into sub groups. On the workstation side we do it by departments (Campus vs Retail Locations) and for servers I split out servers that have a ‘never’ maintenance window and are patched manually. All of the charts and legends are drill-downs to the Overall Compliance – Devices report. Each dataset and chart is limited using a parameter listing the name of a collection. Therefore you will want to modify the default values for the CollName parameters as well as the Days parameter if you define compliance differently.
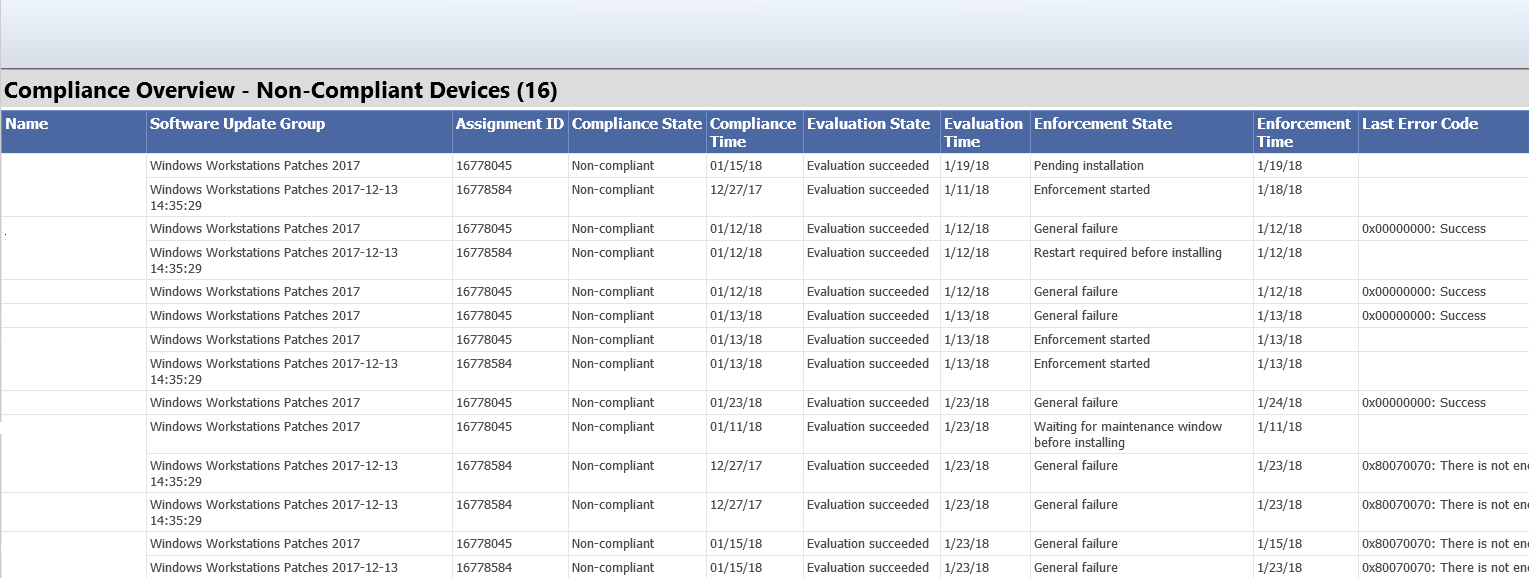
Overall Compliance – Devices
This report is the first drill-down report from the Overall Compliance report. For devices in the selected state and collection it will list the status of each deployment as well as evaluation and error details. This report isn’t meant to be ran directly but if you do for some reason you will want to change the default values for the CollID and Days parameters.
Compliance for A Specific Computer
This is the bottom level detail report focused on a single client. There’s a chart showing the device’s overall compliance as well as some relevant details about that client. When entered from the Overall Compliance – Devices report the update list will only include those with the drilled-into status. This report is also useful as a stand-alone report so you may want to modify the UpdateState and Days parameters.

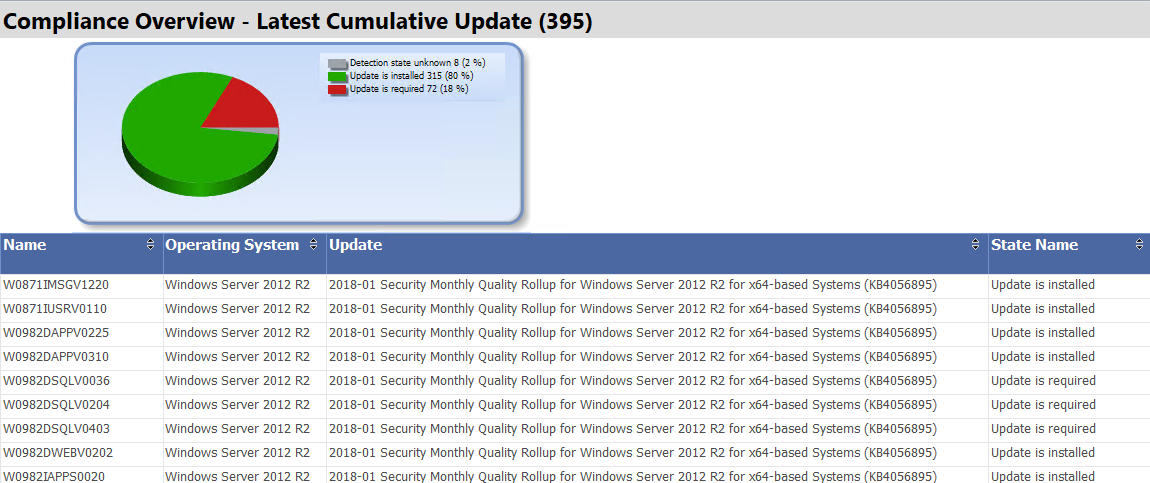
Compliance Overview – Latest Cumulative Update
I released and blogged about this report last week: Compliance Report for Latest Cumulative Updates. I’m including it here for completeness and because I have updated it to be more interactive.
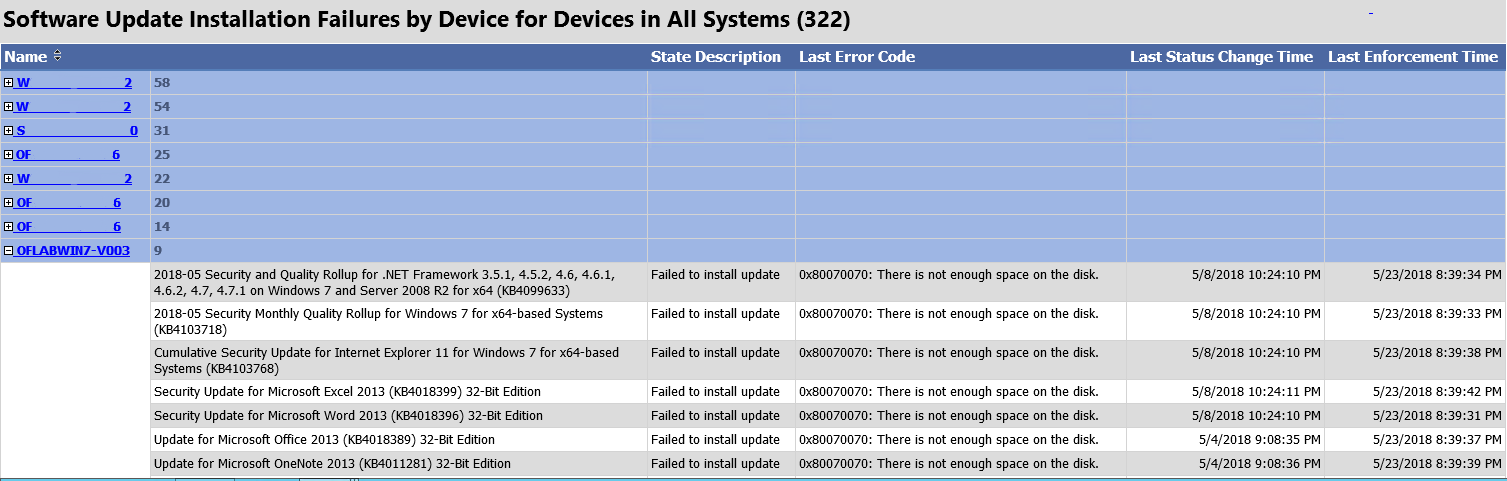
Software Updates – Computers with Failures
This report will list all devices in the selected collection that have reported errors. By default it is sorted so that the clients with the highest error counts appear first. You can expand each device to list the updates that failed and details about that failure. This is a good report to give your lower level admins or technicians. Document common errors that you can’t otherwise automate (ex. disk space) and have them go forth and remediate.
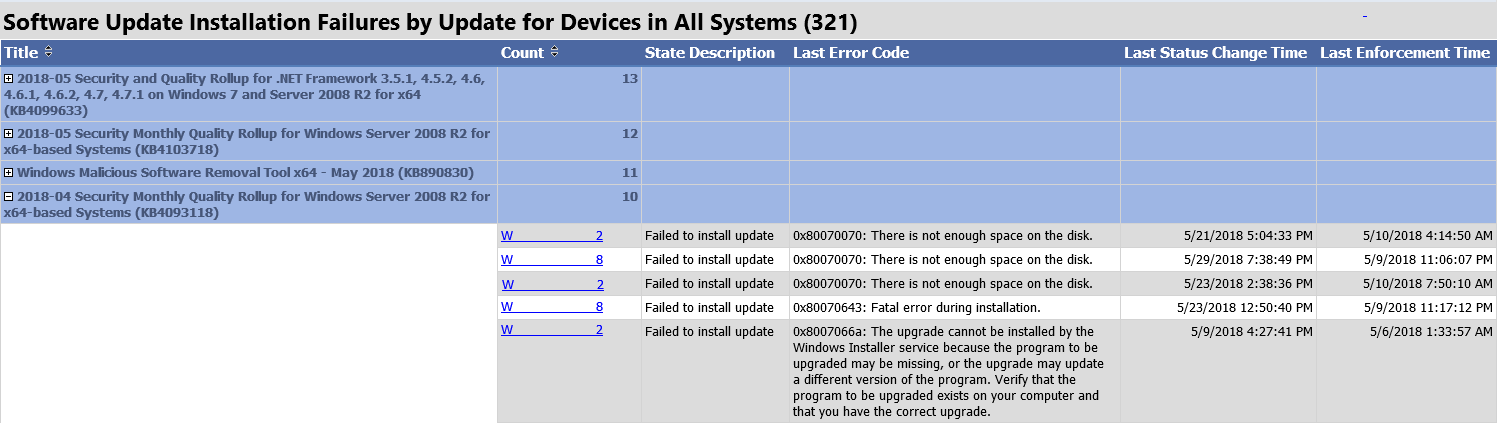
Software Updates – Updates with Failures
This report is the same data as the previous report but grouped by update rather than device. This allows you quickly see which updates are failing most often in your environment.
Installing the Reports
You can search online for far better instructions than I’m prepared to give here for how to import the reports. If you’re too lazy to search but not too lazy to try and work off poor instructions, here’s what you need to do.
- Navigate to the SSRS reports page on your Reporting Services Point server (ex. http://RSPSERVER.domain.com/reports)
- Create a folder and upload the report files one at a time.
- Edit the report in Report Builder.
- Change the Data Source to your SSRS server’s data source.
- Edit the header images to reference your top-level report folder by replacing ### with your site code.
- Edit the parameters discussed above as desired.
- Save the report.
- Thinks about the life choices you’ve made that have lead to this point.

Hey, anychance the report can select a collection? and how would we do that?
Hi Bryan, thanks for these reports. For some reason the Dashboard shows Unknown (100%) next to All Devices, All Workstations and All Servers. Any ideas what’s gone wrong? I changed the Data Source and Header Image
At the top level dashboard the compliance is based on per-device compliance for deployments. So if it shows unknown that means one of two things. Either zero deployments are found with a deadline older than the specified days or of the deployments found one or more deployments are listed as unknown. If you drill down a couple levels into the Overall Compliance – Devices report it should list the devices, their deployments, and the deployment’s status.
Thanks Bryan, that’s it! Thought I’d imported them incorrectly but just the old ID 10 T error
Just revisiting this. Looks like because we run ADR’s weekly and they reuse the same SUGs the deployments are only ever up to a week old. We have one ADR for updates 7 days. I will look at changing the deployment on the > 7 days ADR/SUG to not be recreated and then I can use your reports properly. Cheers
Change the Data Source to your SSRS server’s data source.
Change Source and test with successfully
Edit the header images to reference your top-level report folder by replacing ### with your site code.
Wher do i do that
Try saving the report and got errors
Hi Peter, I think as soon as you Edit the Report you can click on the banner at the top and ‘select Image properties’, then under ‘Use this image’ you make the change
What license (if any) is Yet Another Software Update Dashboard released under?
I really need to:
A) Update these to reflect some new realities.
B) Get the on GitHub
C) Add a license info into the files.
But for now, consider it under the same license as my Update Script (GPLv3): https://github.com/bryandam/SoftwareUpdateScripts/blob/master/Invoke-DGASoftwareUpdateMaintenance/Invoke-DGASoftwareUpdateMaintenance.ps1
I’m trying to use the Latest cumulative Update report but everything comes back as “Cumulative Update Not Found” I’m wonder if I’m missing something and that’s why it’s not pulling this information. Also detection State Name shows as “detection State unknown” any help you can provide would be greatly appreciated
Hi there,
your reports look awesome with all the charts and everything but it only runs against last cumulative update. I would like to create similar reports (with charts) for separate software update groups.
eg: Windows 10 monthly patching software update group
windows 10 servcing software update group
office 365 monthly patching software update group
office 365 servicing software update group
Can you please assist
Thanks
REPLY
An attempt was made to set a report parameter ‘UpdateState’ that is not defined in this report. (rsUnknownReportParameter) on the latest cumulative report when drilling in to Update is required
Hello, great reports, but a lot of computers give the OS not Found, also the update is then not found?? We currently have W10 enterprise 1607 and 1709 builds running.
Hello.. Just installed these.. Any ideas why I’m getting the below? Thanks
https://i.imgur.com/jdFZ9ZJ.png
Thanks for the Dashboards!
I am running into an issue with a couple computers where if I look at the Overall Compliance – Devices Report. A computer will show up in this list showing that it needs updates.
However if drill down on the computer and choose “Update is Required” it shows that there are no updates and that it is compliant.
So that stems from how the reports are designed and for good reason break one of the golden rules about multi-level reports.
Every report ‘above’ the individual device report uses the status of the Software Update Group deployment. This is for two reasons. First, speed. The top level dashboard would be basically unusable if it had to calculate the status of every individual update for every individual device. Using SUG compliance as a proxy makes it much more palatable but admittedly less accurate. Second, deployment grace period (the days parameter). In order to define compliance in a way that includes ‘x days after the deadline’ you need to base your data off deployment data.
So what you’re seeing is a mismatch between the SUG compliance and the compliance of the individual updates in that SUG. You are going from the former to the later when you drill down from the other reports down into the ‘Specific Computer’ report. The SUG compliance is a summarized figure so it lags behind reality (the individual update compliance) and sometimes it’s just flat-out wrong for whatever reason.
I am trying to run individual report “Compliance for A Specific Computer”, but getting an error: An error has occurred during report processing. (rsProcessingAborted)
Query execution failed for dataset ‘ClientDetails’. (rsErrorExecutingCommand)
Invalid column name ‘TopConsol###er0’.
Not sure what i need to change?
Thank you.
Ah yes, search and replace fail on my part in the version I silently released right before MMS. Just uploaded what should be a fixed version so try that and let me know. You should only need to overwrite the ‘Compliance for Specific Computer’ report.
Hi Bryan,
Thanks for the excellent post. I was hoping you might be able to clarify a few things:
You mentioned in your post that “A device is considered unknown if any deployment status is unknown”. In my case I have a Device Collection containing 39 servers and the top level report is showing Unknown at 100%. There is only 1 Software Update Group deployed to this Device Collection and its compliance is 97% if I use the “Compliance 1 – Overall Compliance” built-in report.
Do you know why the servers might be showing a status of 39 Unknown (100%) using this custom dashboard? All of the other OS types seem to be reporting just fine.
Justin, drill down to the ‘Overview By Devices’ report for the unknown servers in that collection. There it will list the devices and the status of each update deployment. In theory, one or more deployments should be reported as ‘unknown’.
Hi,
This is brilliant work. I have just spent the past week or so updating our servers to the latest patch levels ahead of an upcoming audit and this report is exactly what I am looking for. One really small thing I have noticed though, and can’t work out how to fix. If you click on the pie chart at the top of the left hand side, you are taken to the sub report as expected.. However if you click on the value with the legend you get The item’/configMgr_##### cannot be found. All the other legends work fine just the All workstations one.
Keep up the great work.
Cheers
Paul.
Sorry Paul, I _finally_ fixed the comment notification. I uploaded a new version this week. I’m not totally sure that I fixed the issue you mention so let me know if the bug is still there. I have a couple other ideas that I got from Garth Jones while prepping for our MMS session so I plan on updating them again in the next couple of weeks.
Thanks, I appreciate the good work 🙂
I’m getting an error: Cannot find either column “dbo” or the user-defined function or aggregate “dbo.fn_rbac_GetAdminIDsfromUserSIDs”, or the name is ambiguous.
Sorry for the late reply Steve … I seemingly am not getting notification regarding comments. What version of ConfigMgr are you using? That function is a foundational one for RBAC so if it’s not there … I’m not sure what to tell you.
Hi there,
your reports look awesome with all the charts and everything but it only runs against last cumulative update. I would like to create similar reports (with charts) for separate software update groups.
eg: Windows 10 monthly patching software update group
windows 10 servcing software update group
office 365 monthly patching software update group
office 365 servicing software update group
Can you please assist
Thanks